Understanding Analytics: Tracking and Analyzing Website Traffic on QuickServers
Introduction
Monitoring website traffic is essential for understanding visitor behavior, optimizing performance, and improving your website’s overall success. With analytics tools, you can gather data on how users interact with your site, which pages are most popular, and where improvements can be made. This guide will walk you through tracking and analyzing website traffic on your QuickServers website.
1. Why Analytics Matter
-
Understanding Visitor Behavior:
- Analytics provide insights into how users find your website, which pages they visit, how long they stay, and what actions they take. This data helps you tailor your content and improve user experience.
-
Improving SEO:
- Analytics tools can reveal which search terms bring the most traffic to your site. Optimizing content based on this data can boost your search engine rankings, leading to more organic traffic.
-
Tracking Conversion Goals:
- Whether your goal is form submissions, purchases, or newsletter sign-ups, tracking conversions allows you to assess how effectively your site meets its objectives.
2. Integrating an Analytics Tool
To start tracking your website traffic, you’ll need to integrate an analytics tool. Google Analytics is one of the most popular options and provides comprehensive data on your site’s performance.
- Step-by-Step Integration:
-
Sign up for Google Analytics:
- Create an account on Google Analytics and set up a property for your QuickServers website.
-
Get Tracking Code:
- Google will provide a unique tracking code for your website. This code needs to be placed on every page you want to track.
-
Adding the Code to Your Website:
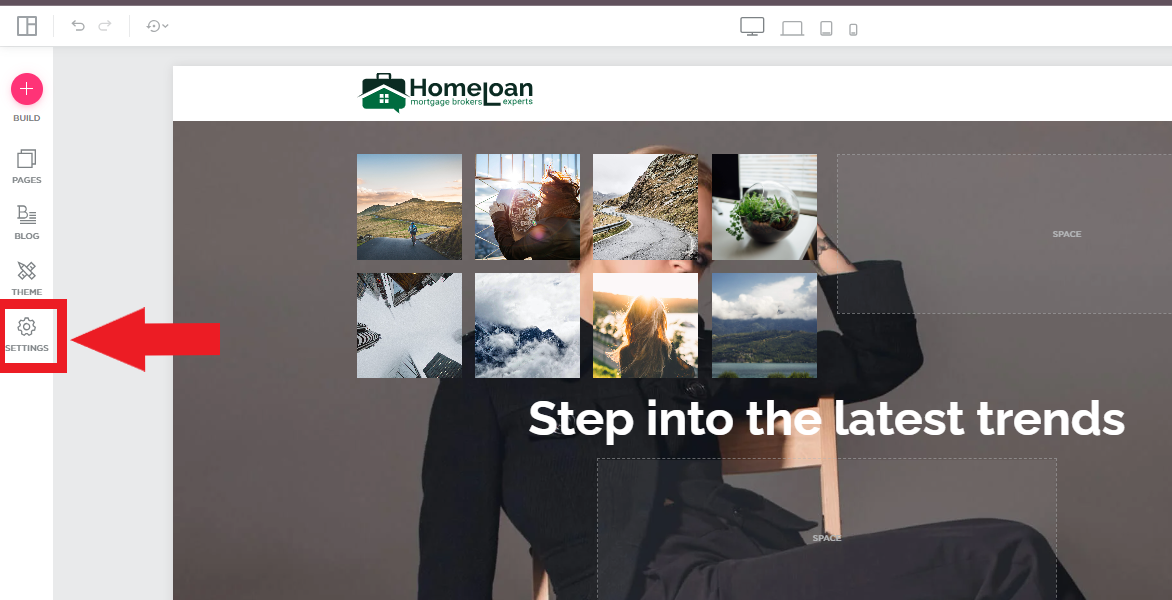
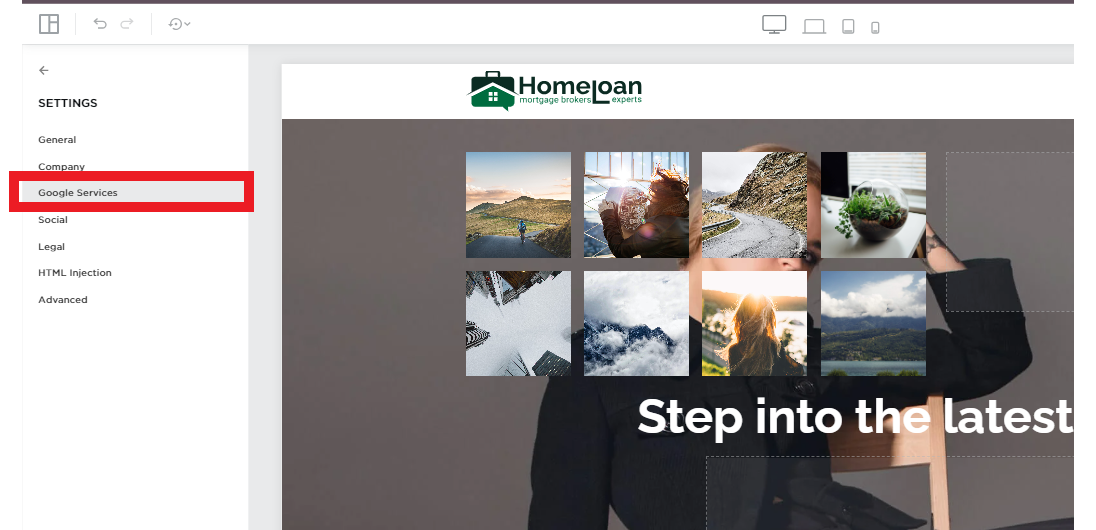
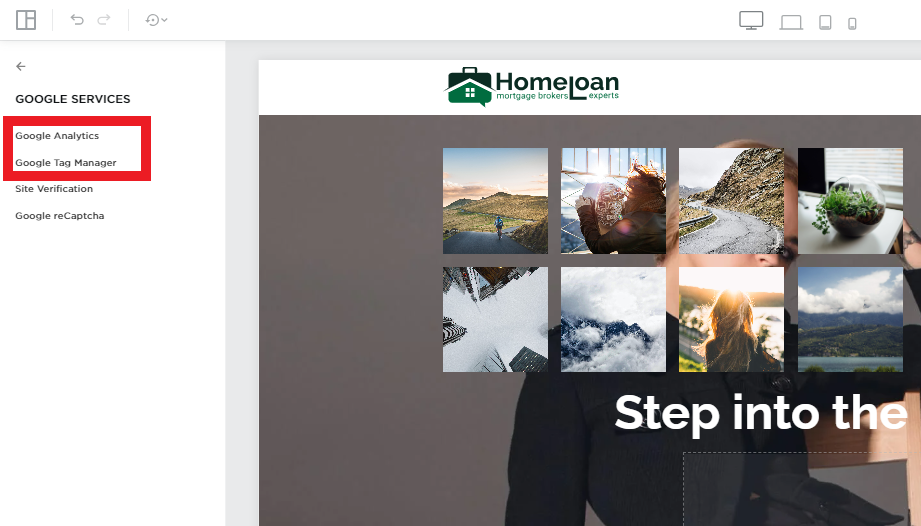
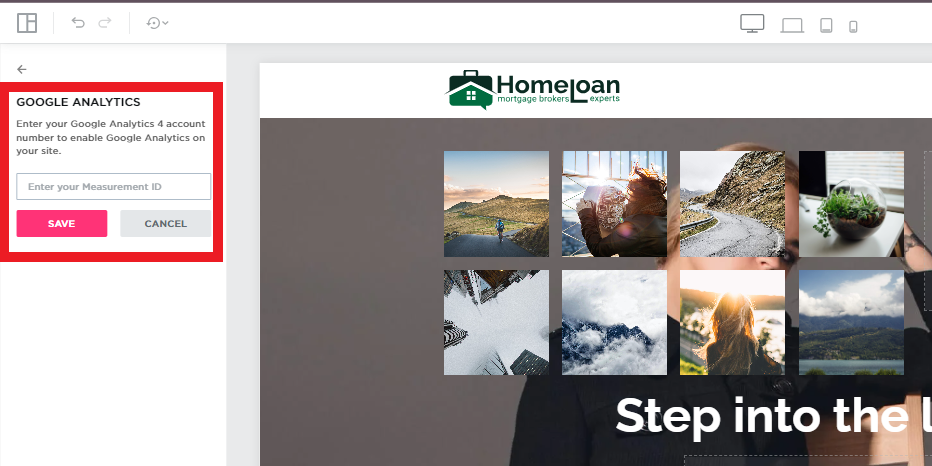
- Log in to your QuickServers dashboard and navigate to the site settings. There, you can add the Google Analytics tracking code to the header of your website, ensuring it’s present on every page.
-
Verify Tracking:
- After adding the tracking code, you can verify if it’s working by checking the real-time report in Google Analytics. This will show you live visitors on your site.


- After adding the tracking code, you can verify if it’s working by checking the real-time report in Google Analytics. This will show you live visitors on your site.
-
3. Key Metrics to Track
-
Page Views:
- The total number of pages viewed by visitors. It helps you understand which pages attract the most traffic.
-
Bounce Rate:
- The percentage of visitors who leave your website after viewing only one page. A high bounce rate can indicate that visitors aren’t finding the content they expected.
-
Session Duration:
- The average amount of time a visitor spends on your site. Longer sessions generally indicate better user engagement.
-
Traffic Sources:
- Analytics tools can show where your traffic is coming from—search engines, social media, direct visits, or referral sites. This helps you understand which marketing efforts are driving the most traffic.
-
Conversion Rate:
- The percentage of visitors who complete a desired action, such as filling out a contact form or making a purchase.
4. Creating Custom Reports
Google Analytics allows you to create custom reports based on the specific metrics and dimensions that matter most to your website. You can filter data by date range, traffic source, user demographics, and more.
- Benefits of Custom Reports:
- Tailor your analytics to focus on specific goals, such as tracking performance for a particular marketing campaign or understanding the behavior of users from different regions.
5. Analyzing and Optimizing Website Performance
-
Identify Underperforming Pages:
- Use analytics to identify pages with high bounce rates or low session durations. This could indicate that the content needs improvement or that the page isn’t meeting user expectations.
-
A/B Testing:
- Experiment with different layouts, headlines, and call-to-actions to see what resonates best with your audience. Analytics will help track the success of each variation.
-
Mobile vs. Desktop Traffic:
- Track the devices your visitors use to access your site. Ensure your website is optimized for both desktop and mobile users to improve user experience across all devices.
6. Setting Up Goals and Tracking Conversions
-
Defining Goals:
- Google Analytics allows you to define goals based on user actions like form submissions, clicks, or purchases. Setting up goals helps you measure how well your website performs in terms of conversions.
-
Tracking Funnels:
- A conversion funnel represents the steps a user takes before completing a goal. Tracking these steps allows you to identify where users drop off and make necessary improvements to your site’s flow.
Conclusion
Understanding and analyzing website traffic through analytics tools is essential for optimizing your QuickServers website’s performance. By tracking key metrics, creating custom reports, and regularly analyzing the data, you can make informed decisions to enhance user experience, improve SEO, and drive conversions. Start integrating analytics today and watch your website’s performance grow!

